Over the past decade, India's economic trajectory has been marked by significant challenges that highlight both systemic issues and external pressures. From currency depreciation to rising inflation, the economic indicators paint a sobering picture of the hurdles facing the nation.

Dollar to Rupee Depreciation

The Indian rupee has seen a marked decline against the US dollar, moving from Rs 62 in 2014 to Rs 85 in just ten years. This nearly 37% depreciation reflects various factors, including global economic dynamics, domestic fiscal policies, and geopolitical uncertainties. The weakened rupee has made imports costlier, particularly crude oil, which has cascading effects on inflation and consumer spending.

The Rising Cost of Petrol

Petrol prices have surged from Rs 71 per liter in 2014 to Rs 106 per liter during the same period. This steep increase has strained household budgets and raised transportation costs, affecting both urban and rural populations. The rising fuel costs also contribute to inflation, as higher transportation expenses ripple through supply chains, making goods and services more expensive.

Stagnant Salaries Amid Inflation

Despite rising costs, salaries for a large segment of the population have remained stagnant or have failed to keep pace with inflation. This mismatch has led to reduced purchasing power and heightened economic stress for the middle and lower-income groups. Real wage growth, a critical indicator of economic health, remains a concern, highlighting the need for policies that address wage stagnation and income disparity.

Lack of Quality Job Creation

India's demographic dividend is at risk as the economy struggles to create quality jobs. While the workforce continues to grow, the lack of opportunities in sectors requiring skilled labor poses a significant challenge. Many graduates find themselves either unemployed or underemployed, a situation that undermines economic growth and social stability.

Increasing Trade Deficit

India's trade deficit has widened, driven by higher imports and sluggish export growth. The reliance on imported goods, including energy and technology, exacerbates the deficit. While efforts to boost domestic manufacturing through initiatives like "Make in India" have been launched, their impact has been limited.

Hesitant Investments and Persistent Corruption

Companies have shown reluctance to invest, citing policy uncertainties, bureaucratic hurdles, and systemic corruption. Despite reforms aimed at improving the ease of doing business, corruption remains a pervasive issue, eroding investor confidence and hampering economic progress.

Societal Divisions: A Growing Concern

Beyond economic indicators, social cohesion appears to be under strain. Indians are increasingly polarized, with conflicts not just confined to domestic issues but extending to diaspora communities abroad. This divisiveness threatens to overshadow the collective potential of the nation.

A Glimmer of Hope: Temples from the Past

In the midst of these challenges, the recent attempt to dig for ancient temples from beneath the earth has captured the nation’s imagination. While these endeavour might be culturally and historically significant, it remains to be seen if they can inspire a collective effort to address contemporary challenges. Can the unity and resilience that these temples symbolize lead to meaningful change in today’s fractured landscape?

Conclusion

India stands at a crossroads, grappling with economic and social challenges that require urgent attention. Addressing these issues demands a holistic approach, combining sound economic policies, investments in education and skill development, and efforts to foster national unity. Only through collective will and action can the nation hope to overcome its hurdles and realize its true potential.

xxxxxxxxxxxxxxxxxxxxxxxxxxxxxxxxxxxxxxxxxxxxxxxxxxxxxxxxxxxx

एक दशक की चुनौतियाँ: भारत का आर्थिक परिदृश्य

पिछले दशक में भारत की आर्थिक यात्रा कई महत्वपूर्ण चुनौतियों से घिरी रही है, जो प्रणालीगत मुद्दों और बाहरी दबावों को उजागर करती हैं। मुद्रा अवमूल्यन से लेकर बढ़ती महंगाई तक, आर्थिक संकेतक देश के सामने मौजूद बाधाओं की गंभीर तस्वीर पेश करते हैं।

डॉलर के मुकाबले रुपये का अवमूल्यन

भारतीय रुपया अमेरिकी डॉलर के मुकाबले पिछले दस वर्षों में Rs 62 से Rs 85 तक गिर चुका है। लगभग 37% की इस गिरावट का कारण वैश्विक आर्थिक गतिशीलता, घरेलू वित्तीय नीतियां, और भू-राजनीतिक अनिश्चितताएं हैं। कमजोर रुपया आयात को महंगा बना रहा है, खासकर कच्चे तेल को, जिसका महंगाई और उपभोक्ता खर्च पर व्यापक प्रभाव पड़ता है।

पेट्रोल की बढ़ती कीमतें

इसी अवधि में पेट्रोल की कीमतें Rs 71 प्रति लीटर से बढ़कर Rs 106 प्रति लीटर हो गई हैं। इस तेज वृद्धि ने घरेलू बजट पर दबाव डाला है और परिवहन लागत बढ़ा दी है, जो शहरी और ग्रामीण दोनों आबादी को प्रभावित करती है। बढ़ती ईंधन लागत से महंगाई में भी वृद्धि होती है, क्योंकि उच्च परिवहन खर्च आपूर्ति श्रृंखला पर असर डालता है और वस्तुओं और सेवाओं को महंगा बना देता है।

स्थिर वेतन और बढ़ती महंगाई

बढ़ती लागत के बावजूद, बड़ी जनसंख्या के लिए वेतन स्थिर है या महंगाई की दर के साथ नहीं बढ़ रहे हैं। इस असंगति ने क्रय शक्ति को कम कर दिया है और मध्यम एवं निम्न-आय वर्गों के लिए आर्थिक दबाव बढ़ा दिया है। वास्तविक वेतन वृद्धि, जो आर्थिक स्वास्थ्य का एक महत्वपूर्ण संकेतक है, चिंता का विषय बनी हुई है, और वेतन स्थिरता तथा आय असमानता को संबोधित करने के लिए नीतियों की आवश्यकता है।

गुणवत्तापूर्ण नौकरियों का अभाव

भारत की जनसांख्यिकीय लाभांश संकट में है क्योंकि अर्थव्यवस्था गुणवत्तापूर्ण नौकरियां सृजित करने में संघर्ष कर रही है। जबकि कार्यबल लगातार बढ़ रहा है, कुशल श्रम की आवश्यकता वाले क्षेत्रों में अवसरों की कमी एक महत्वपूर्ण चुनौती प्रस्तुत करती है। कई स्नातक या तो बेरोजगार हैं या उनकी क्षमता से कम काम कर रहे हैं, जो आर्थिक विकास और सामाजिक स्थिरता को कमजोर करता है।

बढ़ता व्यापार घाटा

भारत का व्यापार घाटा बढ़ रहा है, जो उच्च आयात और सुस्त निर्यात वृद्धि के कारण है। ऊर्जा और तकनीक सहित आयातित वस्तुओं पर निर्भरता इस घाटे को और बढ़ा रही है। "मेक इन इंडिया" जैसे घरेलू विनिर्माण को बढ़ावा देने के प्रयास शुरू किए गए हैं, लेकिन उनका प्रभाव सीमित रहा है।

निवेश की झिझक और स्थायी भ्रष्टाचार

नीतिगत अनिश्चितताओं, नौकरशाही अड़चनों और प्रणालीगत भ्रष्टाचार का हवाला देते हुए कंपनियां निवेश करने से हिचकिचा रही हैं। व्यापार सुगमता में सुधार लाने के लिए किए गए सुधारों के बावजूद, भ्रष्टाचार एक व्यापक समस्या बनी हुई है, जो निवेशकों का विश्वास कमजोर करता है और आर्थिक प्रगति में बाधा डालता है।

सामाजिक विभाजन: एक बढ़ती चिंता

आर्थिक संकेतकों से परे, सामाजिक सामंजस्य कमजोर होता दिख रहा है। भारतीय तेजी से ध्रुवीकृत हो रहे हैं, संघर्ष न केवल घरेलू मुद्दों तक सीमित हैं बल्कि प्रवासी समुदायों तक भी फैल रहे हैं। यह विभाजन देश की सामूहिक क्षमता को दबा सकता है।

एक आशा की किरण: अतीत के मंदिर

इन चुनौतियों के बीच, हाल ही में प्राचीन मंदिरों का भूमि के नीचे से उभरना देश की कल्पना को प्रेरित कर रहा है। ये खोजें सांस्कृतिक और आध्यात्मिक दृष्टि से महत्वपूर्ण हैं, लेकिन यह देखना बाकी है कि क्या ये समकालीन चुनौतियों को संबोधित करने के लिए सामूहिक प्रयास को प्रेरित कर सकती हैं। क्या ये मंदिर, जो एकता और दृढ़ता का प्रतीक हैं, आज के विभाजित परिदृश्य में सार्थक बदलाव ला सकते हैं?

निष्कर्ष

भारत एक चौराहे पर खड़ा है, आर्थिक और सामाजिक चुनौतियों से जूझ रहा है, जिन्हें तत्काल ध्यान देने की आवश्यकता है। इन मुद्दों को हल करने के लिए एक समग्र दृष्टिकोण की आवश्यकता है, जिसमें मजबूत आर्थिक नीतियां, शिक्षा और कौशल विकास में निवेश, और राष्ट्रीय एकता को बढ़ावा देने के प्रयास शामिल हों। केवल सामूहिक इच्छाशक्ति और कार्यों के माध्यम से ही राष्ट्र अपनी बाधाओं को पार कर सकता है और अपनी वास्तविक क्षमता को साकार कर सकता है।

Add a comment


Atmnirbharata According to economist Swaminathan Aiyar, can be translated as both self-reliance and self-sufficiency.

In 2020, Prime Minister Modi publicly said; "the state of the world today teaches us that (Atma Nirbhar Bharat) 'Self-reliant India' is the only path. It is said in our scriptures—Eshah Panthah. That is—self-sufficient India”.

For many it might be something amazing and for some ; Nothing new, as these voices one has been hearing for half a century.

But, now we have two terms ; Self Reliance and Self-sufficient.

In economics, self-sufficiency means an economy that requires little to no trade with the outside world whereas, Self-reliance means an economy that is strong and can export, and is not dependent on other economies.

Can the two together possible?

Slogans have also been regularly initiated under Atmanirbhar Bharat ; "vocal for local", '"local for global", "make for world" , "brain drain to brain gain" Make in India and so on,

During the 2020 Independence speech, Mr Modi clarified that "make for world" should go together with 'make in India' and that the slogan "make for world" should be a key slogan like 'make in India' is. 

Prime Minister Modi also emphasised that ; "The mindset of free India should be 'vocal for local'. We should appreciate our local products, if we don't do this then our products will not get the opportunity to do better and will not get encouraged."

Now with so many slogans ; Vocal for local, make for world, make in india, local for global , brain drain to brain gain etc etc, Obviously some ardent lover of Mr Modi was needed to do the explanation, otherwise all this is not only confusing but contradictory also.

So, Amul managing director RS Sodhi said the phrase “vocal for local "meant that products be made competitive vis-a-vis global brands" and that "it didn't mean that one must only buy products that have a logo 'made in India' on it". 

Another explained the meaning of 'local for global', ; locally made Indian products should have global appeal and reach. The slogan has been extended to sectors such as the toy manufacturing; "time to be vocal for local toys".

Proponents of Atmanirbhar Bharat, his cabinet ministers, have said this self-reliance policy does not aim to be protectionist, exclusionist or isolationist. For India, self-reliance means being a larger and more important part of the world economy.

A country unable to design engines for its Tejas and MBT Arjun, which is a four-decade old project, All this sounds contradictory.

Although numerous steps have been taken and Chest thumping being done to substantiate that we are on road towards SELF RELIANCE and SEL SUFFICIENCY but despite all the slogans the GDP share of manufacturing has fallen from 16.7% in 2013-2014 to 15.9% in 2023-2024 and the trade deficit with China has NOT shown any reduction.

TRADE DEFICIT WITH CHINA YEAR WISE.

  • 2020: $45.91 billion
  • 2021: $69.56 billion
  • 2022: $101.28 billion
  • 2023: $83.36 billion
  • 2023-24: Over $85 billion 

Therefore, its worth enquiring what are we doing and what are these Slogans achieving?

The concept of self-reliance has been used by India since before independence, and is not a new concept. Features of the Atmnirbhar Bharat Abhiyan are similar to the Swadeshi movement of 1905 and Khadi movement of Gandhiji, boycotting British schools and British goods. 

Domestic investments in strategic technologies having impact on India’s national security, economic prosperity, and global competitiveness has always been the corner stone of India’s think tank right from our Independence.

And as a result the then Govt took great efforts despite the shortage of resources towards achieving self reliance that resulted in the establishment of BHEL(Bharat Heavy Electricals), Steel Authority of India Plants, Indian Telephone Industries, Hindustan Aeronautics Ltd, Bharat Electronics Ltd, The Cochin Shipyard, ISRO, BARC, Hindustan Machine and Tools factory, Scooters India ltd, Technology institutes etc .

They had the same purpose ; Making India ATMNIRBHAR or SELF RELIANT .

As a result, we made considerable progress in strategic technologies including atomic energy, space, and electronics ; in the development of rockets for the space program as well as missiles.

So, if the current concept of ATMNIRBHARATA is not new but is an ongoing process, why is it being touted as something unique and novel idea.

In the answer lies the problem.

Despite significant efforts toward self-reliance since independence, and some notable successes, India has struggled to fully develop an ecosystem that effectively integrates education, training, research and development, technology scaling, and advanced manufacturing. This challenge arises because when self-reliance, or Atmanirbharta, becomes a political compulsion, it is often overemphasized to the point of losing substance—much like the Khadi movement of the pre-independence era. While that movement mobilized the masses for freedom and impacted the British economy, it eventually became a symbolic facade for political leaders to mask their own prosperity. The ATMNIRBHARTA also subsequently became a compelling Political issue.

As a result, we became protective, isolationist, which did not allow us to compete globally, we continued with Ambassador cars, Lambretta scooters and bulky telephones and watches for years in the guise of achieving ATMNIRBHARATA. Our Institutions of higher education and Research lost their global competitiveness even as they continued to produce large numbers of trained engineers and Science Graduates (770,000 Indian students studied abroad in 2022, with particularly high outward migration by leading engineering students, Tech Mahindra CEO Mr. CP Gurnani says that nearly 94% Engineering Graduates in India are Unemployable).

As a result, we could not become a robust high-technology manufacturing base and we are today importing engines for much hyped MBT Arjun, and the Tejas.

Hope this new Avtar of ATMNIRBHARATA also does not lead us to this façade.

India must avoid a similar fate with this modern Atmnirbharta.

India now finds itself competing for investment with mid-sized emerging markets, such as Vietnam, Malaysia, Thailand, Indonesia, the Philippines, Mexico, and Morocco. India’s R&D ecosystem, infrastructure, ease of doing business, subsidies, workforce, and market access will now be evaluated not in comparison to India's past, but against today's global competitors.

. But ironically we have companies manufacturing AGARBATTIS AND DHOOP BATIS displaying the logo of Make in India.

Add a comment

By Ranu , Economist 


India’s recent economic growth presents a paradox. On one hand, official statistics suggest a resurgent Indian economy, steadily outpacing other major developing economies but on other hand, sector-specific indicators are flashing warning signs.

While much of the world is slowing down, India’s growth seems to be marching forward. In the first quarter of FY24/25 (April-June 2024), India's GDP grew at a remarkable 7.8% year-on-year (y-o-y), continuing a strong trend from FY23/24. However, beneath these glowing statistics lies a different story—one where various indicators of activity in construction, manufacturing, services and agriculture are flashing warning signs.

This contrast paints a picture of two Indias: one marching ahead strongly, and the other grappling with mounting challenges. The puzzling question is, which of these Indias represents the true state of the nation’s economy?

The big gap between GDP and GVA growth rates

To understand this puzzle, it is important to look beyond the GDP growth rate. Gross Domestic Product (GDP) is derived from Gross Value Added (GVA), which calculates the output produced across different sectors – agriculture, construction, mining, manufacturing, and services. Ideally, GDP and GVA growth rates should move in the same direction. However, in recent quarters, GDP growth has not only been substantially higher than GVA growth but has also diverged from GVA growth. This has raised questions about the reliability of the growth narrative.

For instance, while GDP growth increased from 7.7% in FY23/24 to 7.8% in Q1 FY24/25, GVA growth declined from 7.2% in FY23/24 to 6.8% y-o-y in Q1 FY24/25. The reason? A significant contribution from net taxes—taxes collected by the government minus subsidies—has artificially inflated GDP growth. This suggests that the impressive GDP growth might not reflect the actual economic activity happening on the ground.

In a true sense, GVA offers a clearer picture of the economy's health.

Within GVA, economic analysts and the government have highlighted the strong performance of the construction sector due to increased infrastructure spending by the government, a real estate boom and a promising upturn in private corporate investment. Analysts have also dismissed the ongoing weakness in agriculture as temporary and claimed that the sector will turn around second quarter (July-September quarter) onwards, based on their reading of the progression and performance of the Indian monsoon season. But the sector-specific indicators tell a different story.

Is the construction sector really booming?

According to official statistics, the construction sector has boomed, growing at a remarkable growth of 10.5% y-o-y in Q1 FY24/25. The sector grew at similarly high average rate of 10.1% in FY23/24.

But troubling signs emerge once we look a little deeper into the sector. Prices of key inputs in construction sector like steel and cement have declined this year. Industry specialists have attributed this to ‘weak domestic demand’.2 Typically, in a booming construction market, these input prices should be increasing and not falling.

While a few cement companies have increased prices recently to prevent earnings downgrades and protect the value of their stocks, there is wide-spread uncertainty over sustainability of these price hikes.1 This reflects fragility in the market.

My question, therefore, is, can a sector truly be thriving if its foundations are showing signs of weakness?

Why aren’t the Indian companies expanding?

Adding to the puzzle over growth numbers is the cautious outlook of the private corporate sector. In earning calls made to shareholders during May 2024, most private companies raised concerns over GDP growth estimation, their scaled-back investment plans and weak consumer demand in rural areas.3

If the economy were truly on a strong growth path, we would expect companies to be optimistic, expanding their operations and making aggressive investments in the future. Instead, they are holding back, wary of economic uncertainties and policy instability (link to the investment article).

Is Agriculture on the cusp of a turn around?

Agriculture, the largest employer in India, was the worst performer in FY23/24, slowing down to 1.4% in FY23/24. The sector was hit hard by the El Nino phenomenon last year, which brought uneven rainfall and higher temperature. While some economic analysts had predicted a recovery in FY25 (2% y-o-y growth in Q1 FY24/25 hardly seems to be a recovery), expecting better monsoon performance, the reality has been mixed at best.

The monsoon season so far has been unsatisfactory and erratic. Major rice growing states (Punjab, Bihar, MP) are experiencing rain deficit while some parts of the country have had to grapple with floods (Northeast India, Gujarat and Himachal Pradesh).4 This presents an increased possibility of prolonged weakness in the agriculture sector till at least Q3 FY24/25 (October-December quarter). The continued struggles in agriculture not only hamper overall growth but also threaten rural demand, which is crucial for sustaining broader economic momentum.

Conclusion

These contrasting narratives of India’s economy – one of rapid growth and the other of steady weakening – are deeply puzzling. While there is no doubt that the Indian economy is growing, how fast has been the growth is a question that no one really knows how to answer. Official statistics will need to acknowledge their failings quickly so that appropriate policy steps could be taken to course correct the Indian economy.

Lack of private corporate investment and policy uncertainty ( https://www.bharatamrising.com/economy-2/latest-2/beyond-the-hype-the-real-story-of-investment-in-india  ), a large and expanding informal sector (https://www.bharatamrising.com/economy-2/latest-2/unmasking-the-realities-of-india-s-vast-informal-sector) and the inability of the government to systematically and effectively address the intensifying challenges of climate change (erratic monsoons, extreme weather events like flash floods, landslides and cloud burst and, higher temperatures) has put India’s growth story in serious trouble.

References

1 https://www.financialexpress.com/business/industry-cement-companies-announce-price-hike-amid-demand-slowdown-earnings-downgrades-will-it-sustain-3598730/

https://www.business-standard.com/markets/stock-market-news/street-positive-on-cement-stocks-despite-pricing-pressures-demand-woes-124090200736_1.html

2 Even if one accounts for the Chinese dumping steel at cheap prices in India, a robust domestic demand should be sufficient to absorb the excess supply of steel and, thus, counter the falling steel prices.

https://economictimes.indiatimes.com/industry/indl-goods/svs/steel/low-domestic-demand-chinese-dumping-depress-steel-prices/articleshow/110977137.cms?from=mdr

3 https://indianexpress.com/article/business/economy/as-india-inc-commends-gdp-growth-some-concerns-private-capex-sluggish-rural-demand-9331772/#:~:text=As%20India%20Inc%20wraps%20up,in%20private%20capital%20expenditure%3B%20and

4 https://timesofindia.indiatimes.com/city/surat/farmers-want-survey-for-crop-damage-compensation/articleshow/110130230.cms

https://www.deccanherald.com/india/uttar-pradesh/up-floods-18-lakh-people-in-over-900-villages-affected-3103289

https://www.reuters.com/world/india/indias-monsoon-expected-be-prolonged-threatening-ripe-crops-sources-say-2024-08-29/

Add a comment


                                               By Ranu, Economist


Rammohan is a gardener,( maali), who visits my parents’ house once a week to take care of their garden. He does similar work for other houses in the locality, earning around 6,000 rupees a month, which totals 72,000 rupees a year. In statistical jargon, Rammohan is a self-employed individual or an own account enterprise (OAE). This means he works for himself, earning a fixed monthly wage but without access to paid leave, social security benefits like provident fund (PF), gratuity, medical facilities and, a written job contract. Like many other gardeners, maids, mechanics, tea and vegetable sellers etc., Rammohan is also a part of India’s vast informal sector.

***

We often ask this question - why we should care about workers such as Rammohan? After all, they provide us services at cheap rates and make our lives more convenient and gradually they will also benefit from the trickle down effect. Moreover, this vast informal sector does not seem to be causing any harm to India’s economic growth, with real GDP averaging a strong 6.5% annually over the past two decades.

But if India needs to grow faster, to be able to achieve the high-income status like South Korea, Japan, US and the UK, it needs to grow by 8% over the next decade. This faster economic growth can only come if our consumption and investment increases. To achieve the former, India needs to provide more quality jobs or formal jobs which in turn increase the incomes, thereby, pushing up consumption of goods and services. This would also attract more investment in the economy, as companies are likely to expand in response to a promising outlook where more people can afford their products.

However, if India continues to add thousands of uneducated/unskilled and low-paid workers to the already large informal sector – which accounts for half of the total employment in the country – it will be difficult to achieve the upper-middle-income status in the next 10 years, let alone becoming a high-income country by 2047, which is the Indian government’s ambitious target.

In this context, I should be applauding the recently released preliminary survey results for the informal sector (conducted by India’s statistical agency), which show a decline in the sector’s contribution to the country’s total output (gross value add/GVA) from 9.2% in FY16 (April 2015-March 2016) to 6.3% in FY231. Theoretically, this suggests an expansion of the formal sector, where jobs come with social security benefits (like PF, gratuity) and a written job contract.

But the reality is quite different! This decline in the informal sector is not leading to an increased size of the formal sector. Surprised? Let’s try to understand the reality.

Understanding the realities of India’s vast informal sector

Few economic analysts have been celebrating the ‘shrinking’ of the informal economy, but this celebration is premature. There are some troubling facts, which have not been covered by these analysts.

Firstly, the Survey for the informal sector covers informal enterprises only in the manufacturing and services sectors, leaving out the largely informal agriculture and construction sectors. Agriculture is fully informal as it is not taxed and, more than 80% of employment in construction activities is concentrated in informal enterprises. Upon combining the gross value add (GVA) output of all these sectors – manufacturing and services informal enterprises, agriculture and construction – the size of the informal economy is estimated to be roughly 33% of India’s GVA in FY23 (Table 1). This is lower than the 36.2% share of GVA in FY11, thus, reflecting that the informal economy has reduced. But this decline has come when GVA share of only informal manufacturing and services enterprises has been taken into account, leaving the GVA shares of agriculture and construction sector, which has increased.

Table 1: Size of the informal economy


FY11

FY16

FY22

FY23

% share in India’s gross value add


Share of manufacturing and services informal enterprises in the economy

8.9

9.2

6.2

6.3

Share of agriculture

18.4

17.7

18.9

18.2

Share of construction

8.9

7.9

8.5

8.8

Share of informal economy

36.2

34.8

33.6

33.3


Source: MoSPI, RBI

Secondly, the increased GVA share of agriculture is a cause of concern because it signifies a backward shift from the formal and modern sectors of manufacturing and services to the low paying agriculture work. This backward slide is further evident in the increased employment share of agriculture, from 41% in FY19 to about 45% in FY23. India’s agriculture sector already has a larger than usual share of total employment compared to other developing economies where the average employment share in the agriculture sector was about 25% percent in 2023.  

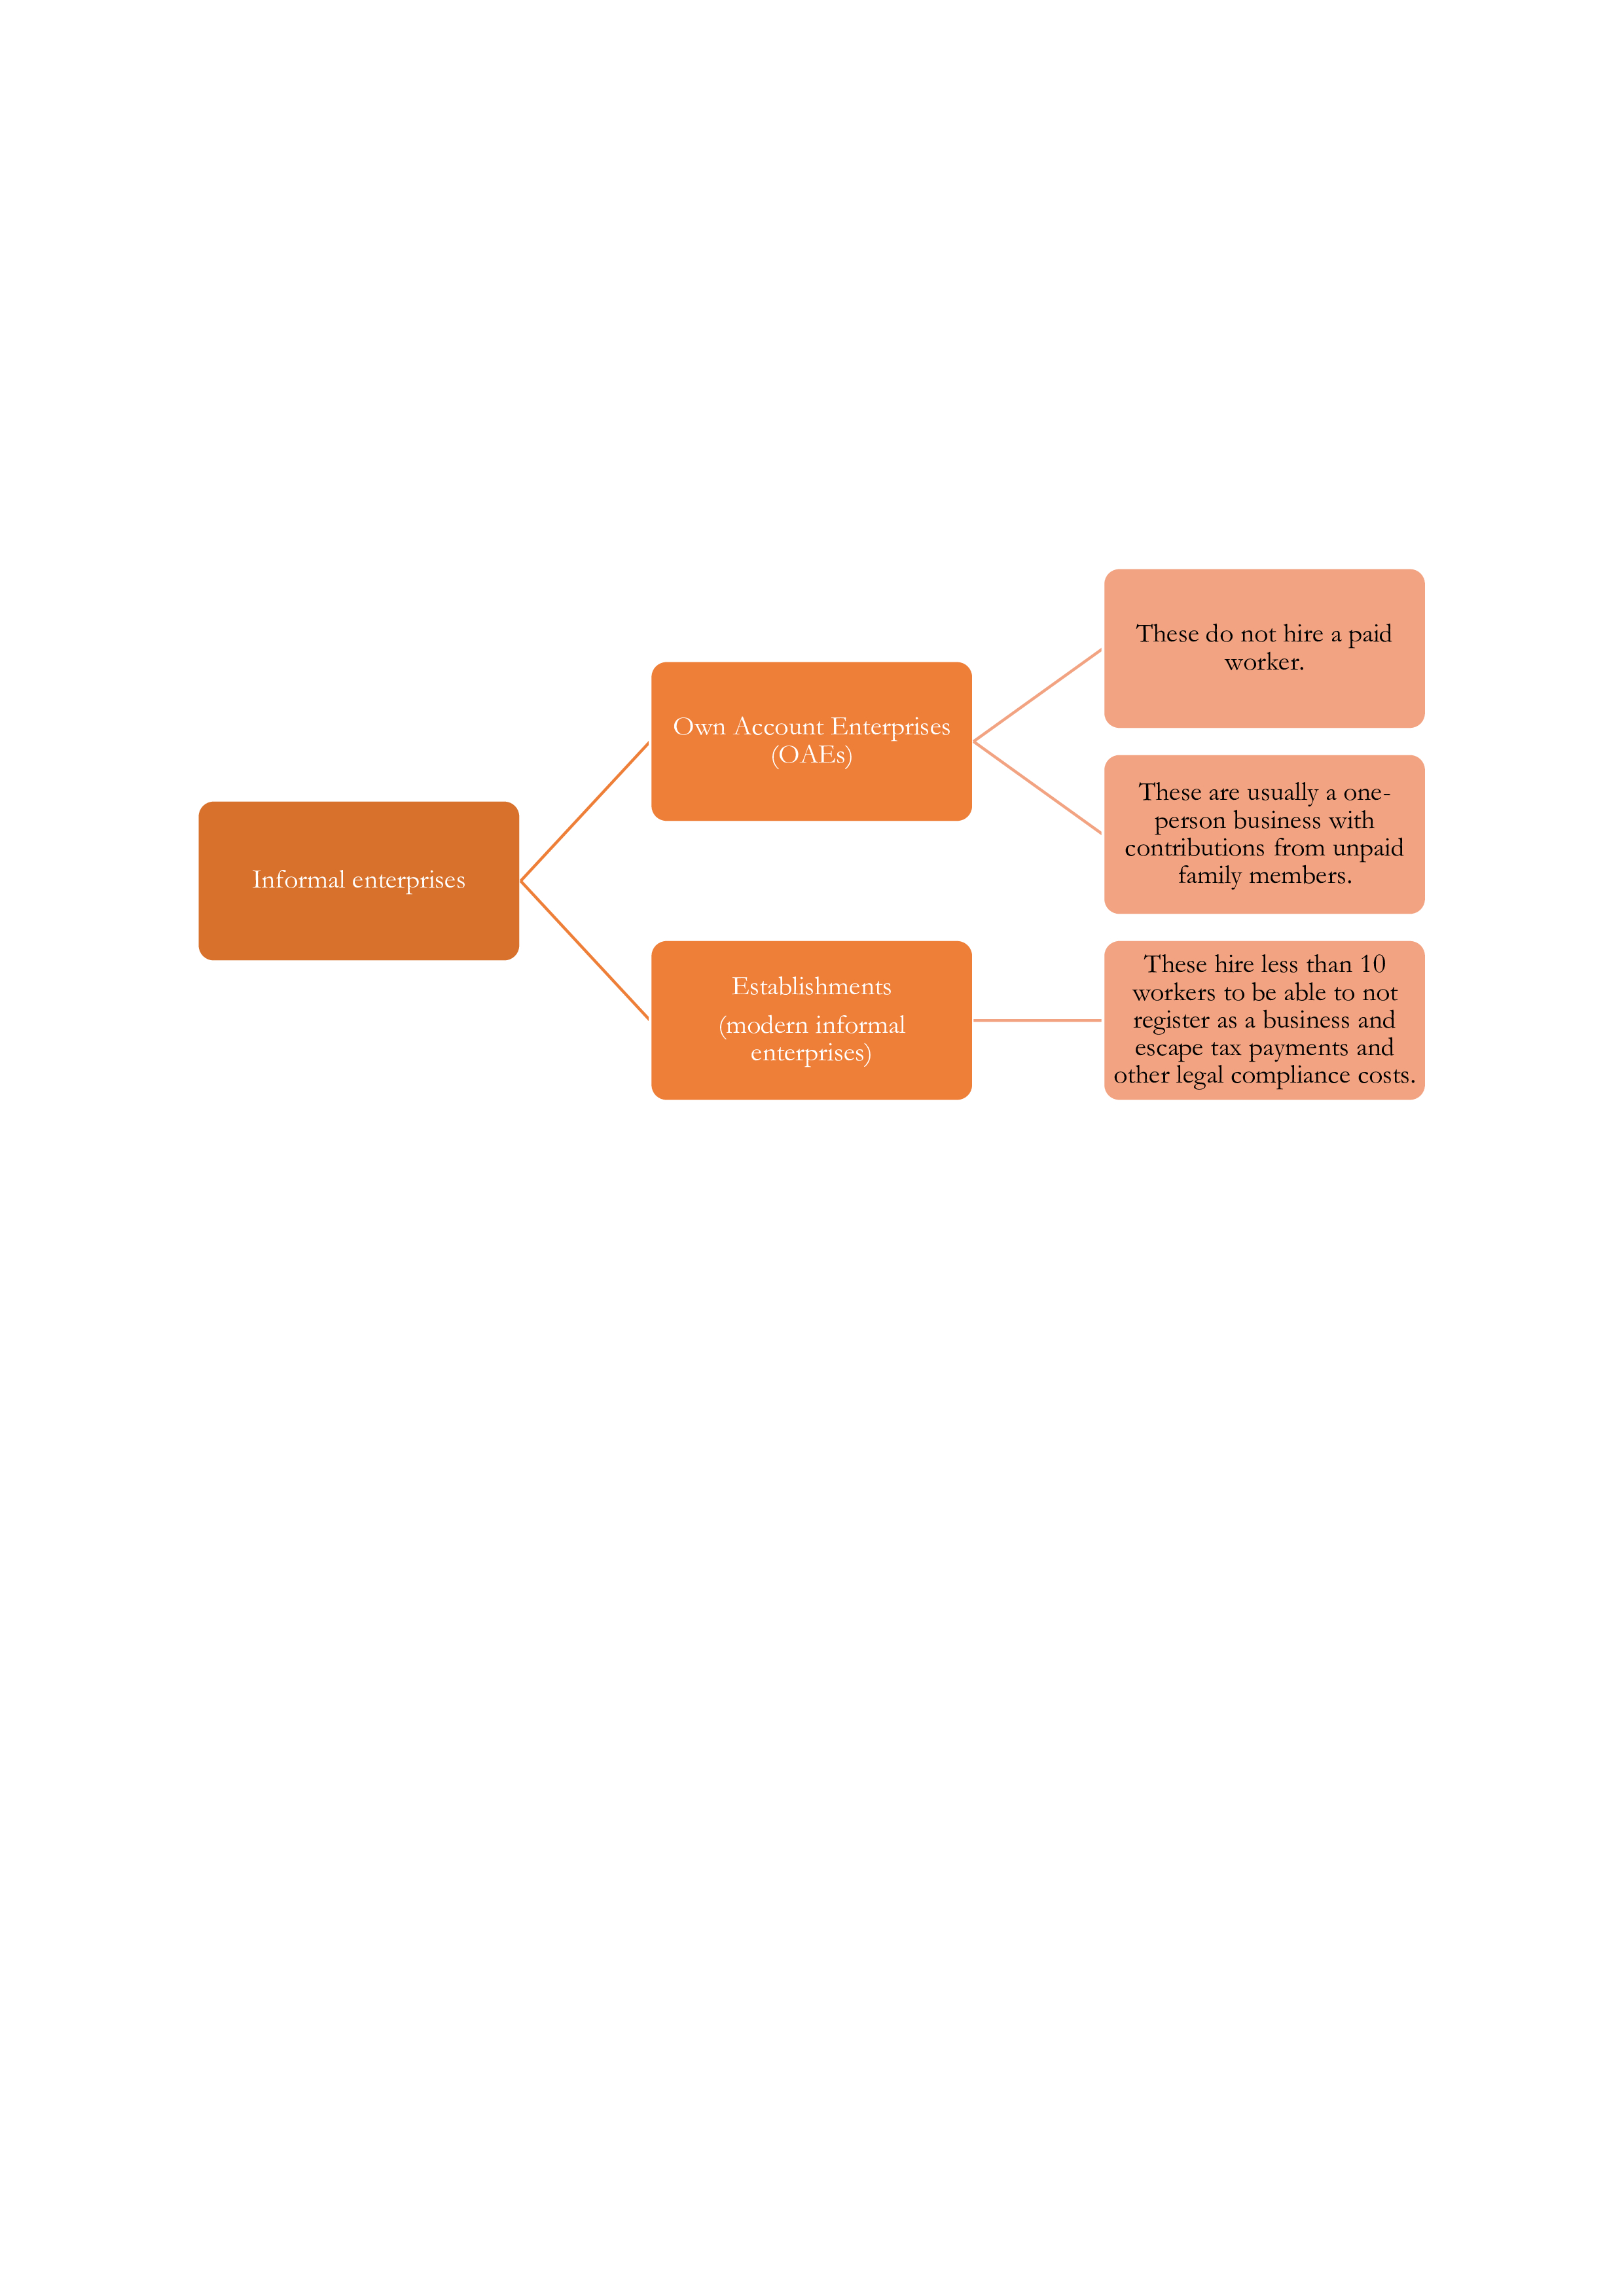
Finally, in very simple terms, the informal enterprises are of two types – OAEs like Rammohan and ‘Establishments’ that hire paid workers. These ‘Establishments’ offer better incomes and, are more efficient and modern compared to Rammohan OAEs. However, the informal ‘Establishments’ have declined in number, damaged by the 2016 demonetization and the hastily implemented GST reforms in 2017. As a result, the GVA share of these informal ‘Establishments’ in manufacturing and services enterprises has declined over the last decade, primarily due to the reduced number of informal ‘Establishments’. In contrast, the Rammohan kind of OAEs, which account for more than 80% of the informal enterprises, have increased massively since FY162 but they provide very low incomes and are extremely inefficient.


Types of Informal Enterprises

Therefore, even though the size of the informal economy has shrunk, it has been accompanied by a backward economic shift to agriculture and a decline in more efficient informal enterprises or ‘Establishments’. So, it would be wrong to state that the workers who lost their jobs, due to the closure of modern informal enterprises, have found formal jobs, because, the share of formal jobs have also declined since FY18.

Serious lack of good quality jobs in India

There are 371 million youth in the country, and most face an uncertain future due to low-income jobs and limited prospects of moving up in the society due to a serious lack of good quality jobs or formal jobs, which come with social security benefits, written job contracts and regular monthly salary. Unfortunately, such jobs are scarce in India and have declined since FY18. The share of jobs that ensure a fixed or regular income every month has declined from 23% in FY18 to 21% in FY23. Moreover, more than half of this small share of regular paying jobs did not provide access to social security benefits in FY23.

Clearly, workers who lost their jobs in the modern informal enterprises (or Establishments) did not find formal jobs. So, where did they go? They have either shifted back to agriculture or become self employed by forming Rammohan kind of OAEs2. Some have even left the workforce, discouraged by the lack of job opportunities (refer to the recent ILO report for a detailed analysis of India’s labor market challenges3).

A tale of two Indias

This vast informal sector, marked by low incomes and a lack of good quality jobs, has given birth to two Indias. People like us, who have gone to reasonably good schools and are earning well enough to shop in malls, live in the shiny new India but people like Rammohan live in the old, poor and rundown India. The problem is that these two Indias are not converging, resulting in deepening income and wealth inequalities in the country.

A typical informal worker in an informal enterprise earns 63% of India’s annual per capita income (GDP of India divided by its total population, which was Rs 1,95,914 in FY23). Almost 18% of total employed workers in the country earn this meager amount every year. What is alarming is that the proportion of per capita GDP earned by these workers has fallen from 79% in FY16 to 63% in FY23. Additionally, workers in the agriculture sector, which holds 42% share of total employment in India, earn just half of the annual per capita income5.

Therefore, the per-worker incomes in the informal enterprises not only increased at a significantly slower pace compared to average national income but they also remain substantially lower than the national per capita income, which is primarily driven by the top 10% income earners. This means that more than half of India’s workforce is living on earnings just sufficient for survival. Given this context, is it possible for India to fulfill its ambitious goal of becoming a high-income country by 2047, without addressing this serious challenge?

Conclusion

So, despite the recent newspaper articles claiming a reduction in the informal sector, the reality tells a different story. The informal sector remains substantial, with significant contributions from the agriculture and construction sectors that are excluded from the official survey of informal enterprises. The overall decline in the informal sector's share of total output masks deeper issues, such as the increasing dependence on agriculture and the shrinking output of more productive informal enterprises.

Addressing these issues requires a complete understanding of the informal sector, which can only be achieved through improved coverage and increased frequency of surveys of informal enterprises. Equally important is the acceptance of survey results, no matter how uncomfortable they might be.

Footnotes

1 This survey – called the Survey of Unincorporated Enterprises – is conducted by India’s statistical agency every five years and covers informal enterprises in the manufacturing and services sectors.

For the ease of understanding I have referred to all annual data in terms of India’s fiscal years, which runs from April to March next year. However, the Survey of Unincorporated enterprises and the RBI’s KLEMS dataset cover annual data from July to June next year – that is, 2015-16 refers to July 2015 to June 2016 period. The difference between the two is not significant for the purpose of this article. Also, all calculations in this article are for nominal values as it would have been difficult to deflate (adjust for inflation) the survey values.

2 The employment share of self-employed workers (or OAEs from the enterprise perspective) has increased from 52% in FY18 to 57% in FY23. This statistic is sourced from the Annual PLFS survey conducted by NSO.

3//www.ilo.org/sites/default/files/wcmsp5/groups/public/@asia/@ro-bangkok/@sro-new_delhi/documents/publication/wcms_921154.pdf">https://www.ilo.org/sites/default/files/wcmsp5/groups/public/@asia/@ro-bangkok/@sro-new_delhi/documents/publication/wcms_921154.pdf

4The percentage share of such enterprises in total informal manufacturing and services enterprises fell from 15.8% in FY16 to 14.9% in FY23.

5 The earnings for agriculture sector is an approximation. First, calculate per employed worker agriculture and allied sector GVA from the KLEMS database of the RBI. Second, use the labor income share provided in the KLEMS database to arrive at an annual earnings figure for an employed worker in the agriculture and allied sector.

Add a comment

By Ranu , Economist 

Investment is the beating heart of the economy, pumping life into every sector. It creates quality jobs, raises incomes and boosts consumption. Investment also drives innovation and productivity growth, which are critical for long-term economic growth.

It is for these numerous benefits that all eyes are on the investment activity in India. For a low-middle income country – amongst the ranks of Pakistan, Bangladesh, Sri Lanka, the Philippines, and Viet Nam – India needs higher investment. Unfortunately, the investment to GDP ratio declined from a peak of 36% in FY08 (April 2007-March 2008) to 29% in FY20. This implies that investment grew at a slower pace than GDP or total output in the country.

The reasons underlying the weakness in investment activity are varied, starting with the end of easy and cheap foreign money flowing into India following the global financial crisis in 2008-09. Thereafter, five years of policy paralysis under the UPA-II government, ten years of unsustainable levels of bad loans with the commercial banks, policy shocks of demonetization and GST reforms, as well as increased economic policy uncertainty, weighed on investment growth.  

Recently, however, Indian analysts and economic commentators have been celebrating a supposed renewed vigor in investment activity. Economic optimism is said to be at a multi-year high, the government’s investment push has supposedly reached massive proportions and, investment in residential property has surged. And given how the balance sheets of commercial banks have been cleaned up of bad loans, a boom in private corporate investment is surely just around the corner!

But remarkably, this optimism and the supposed surge in government and real estate investments is not entirely visible in the official data (released by India’s statistical agency). Moreover, investment in India remains disappointingly weak compared to other developing economies, especially in the manufacturing sector and in the private corporate space.

Public investment growth: overemphasized in the post-pandemic period.

It is true that the GDP share of investment has increased – from 29% in FY20 to 31% in FY23. But this increase was not driven by the supposed surge in public investment (Refer to Figure 1 for the components of investment and for more details read footnote i).

Figure 1: Components of investment
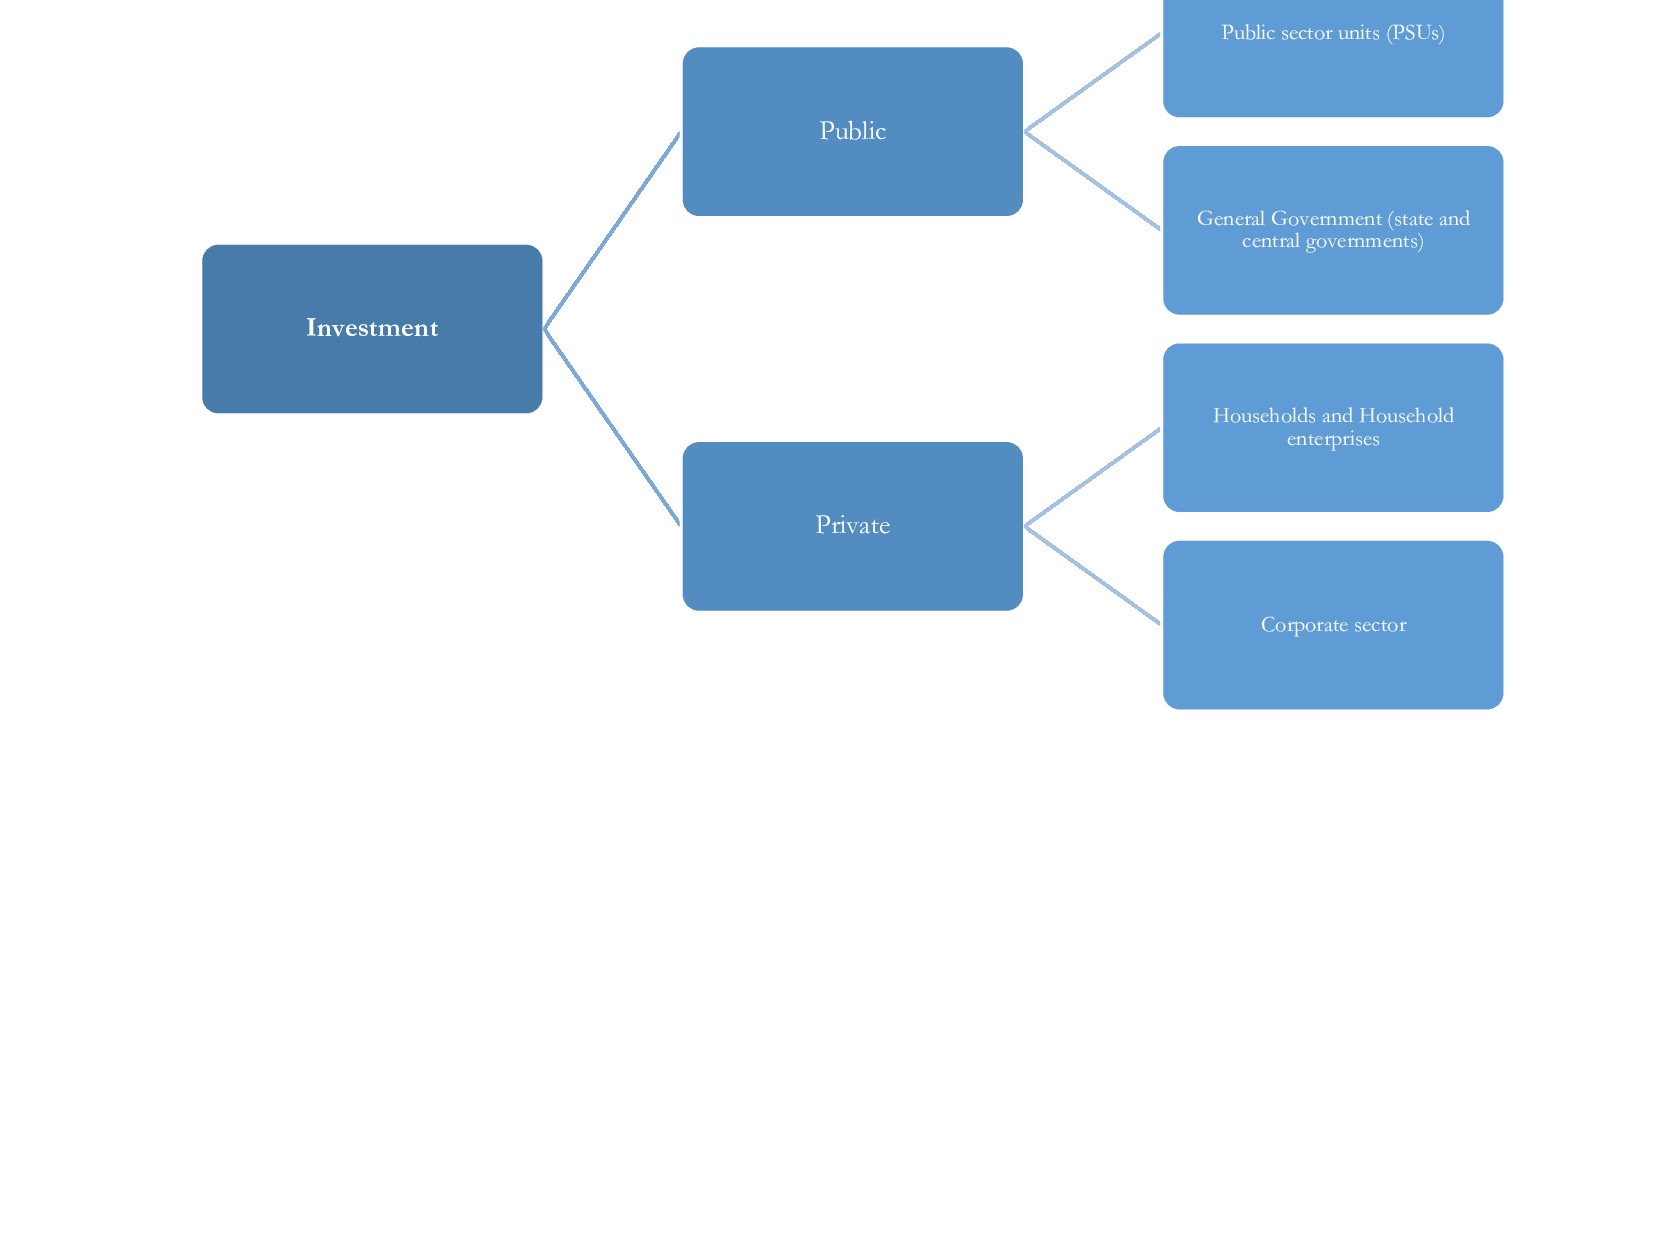


Public investment comprises of spending by public corporations or PSUs (such as ONGC, BHEL etc.) and the general government (state and central governments). Between FY20 and FY23, the GDP share of investment by public corporations declined from 3% to 2.9% but the GDP share of government investment slightly increased from 3.6% to 4.1%. Combining both the components, public investment increased its GDP share only marginally, from 6.6% to 7% (refer to footnote ii for details). This might be confusing because economic commentators have highlighted the spectacular growth rates of government investment – for instance, growth of 31% in FY23. But what matters is the size of the investment with reference to the size of India’s economy. It is similar to throwing two buckets of water in a pond compared to one bucket yesterday. Even though it is a growth of 100% in the number of buckets, the addition of one more bucket of water would still be small as a share of water in the pond.

Contrast this performance of public investment with that of private investment, which has been instrumental in driving up the GDP share of total investment. The GDP share of the private investment increased from 22% in FY20 to 24% in FY23! But does this mean that private corporate investment has been rising? No it does not.

Private investment has increased due to a jump in household investment.

Private investment includes investment activity of: (a) corporate sector or the formally registered companies (like the Infosys, Tata and Reliance conglomerates, Ruchi Soya etc.) and; (b) households and household enterprises (HHs hereafter).

Private corporate investment has maintained its share of GDP at 11% but it is the GDP share of investment by HHs that has increased significantly from 11% in FY20 to 13% in FY23. So where are HHs investing?

The informal sector is expanding.

Investment by HHs in real estate has hardly increased – the share in GDP was 4.2% in FY20, which increased to 4.7% of GDP in FY23. Real estate remains the largest investment category for the HHs, but its share in total household investment has declined over the last decade – falling from 52% in FY14 to 36% in FY23. This significant weakness was caused by the massive slow down in the real estate sector due to the global financial crisis – real estate projects stalled as companies had taken on too much debt from commercial banks, which in turn led to a surge in bad loans and a sharp fall in credit availability in India.

Instead, over the last decade, HHs have invested more in agriculture, manufacturing and services. But how can a household invest in manufacturing or services?

Households in statistical jargon consist of not only family based households but also small unregistered businesses that form the informal sector in India. Think of a small papad and pickle production unit operating out of a house (manufacturing) or your trusted vegetable vendor around the corner (trade services) or an auto rickshaw driver (transport services) or a small tea shop (hospitality and restaurant services). When these businesses invest in new tools to make pickle or buy a brand new auto rickshaw or buy some benches for the tea stall, it gets recorded as household investment in manufacturing, transport and hospitality services.

The GDP share of HH investment in agriculture, manufacturing and trade services, increased from 3.9 % in FY20 to 4.8% in FY23.

But then what about those analysts who keep on writing that Indian households are investing or saving more in physical assets?

Household investment in physical assets is not the same as investing in real estate.

Yes, HHs have been saving or investing in a lot more physical assets, which is termed as ‘dwelling, buildings and other structures’ in statistical jargon. But this does not necessarily mean residential real estate property! A large part of physical assets is non-residential, comprising of tea stalls, mechanic shops, road-side dhabas etc. So, yes, as the economic commentators have been highlighting, investment of HHs in physical assets increased from 7.2% of GDP in FY20 to 9.2% in FY23. But 75% of this increase came from HH investment in non-residential physical assets in the informal sector.

But why is increased investment in the informal sector problematic?

Expansion of informal sector at the expense of the private corporate sector will lead to lower growth in the future.

Productivity levels in the informal sector are significantly lower compared to the formal corporate sector. So increased investment in the informal sector would lead to its expansion, which will depress the productivity levels of the overall economy, promote inefficient use of resources and weaken human capital development due to lower incomes and increased forms of vulnerable employment (such as tea sellers, fruits and vegetable vendors etc.). This will lower India’s long-term growth. Therefore, increased investment in the informal sector is bad news for India and also reflects the inadequate investment by the private corporate sector.

Private investment in India has disappointed compared to other developing economies.

Private investment is important for enhancing market competitiveness, boosting innovation, increasing labor productivity levels, and creating jobs. But private investment has declined in India. After achieving a peak share of 30% of GDP in FY08, India became a low-middle income country (LMIC) in 2009. Thereafter, the share fell to 21% of GDP in FY20. It has, however, improved to 24% in FY23.

Compared to other developing economies, India has lagged in private investment activity. Not only has the GDP share of private investment declined over the years, which is in contrast to the experience of other major developing economies, it is insufficient for a large and diverse country like India. Consider a few major middle-income economies:

  1. Viet Nam achieved the LMIC status in 2011, two years after India transitioned to LMIC. Since then the GDP share of private investment in Viet Nam has consistently increased from 15% to 20% of GDP.
  2. Bangladesh recently transitioned to LMIC in 2015. Private investment to GDP ratio has increased from 22% in 2015 to 25% in 2022
  3. Malaysia was a LMIC in the 1990s (graduated to upper-middle income economy (UMIC) in 1998), the share of private investment in GDP increased from 22% in 1990 to 32% in 1997.
  4. China became a LMIC in 1998 when private investment to GDP ratio stood at 30%, which increased 39% in 2011. China transitioned to UMIC in 2012.

India has also invested considerably less in the manufacturing sector. While in 2022, Viet Nam invested 8% of its GDP in manufacturing and Malaysia invested 19% of its GDP, India invested just 5% of its GDP in the manufacturing sector in FY23. And this share has declined since FY10 (6%). Despite the much publicized production linked scheme (PLI) and Make in India campaign, Indian government has failed to incentivize private investment in manufacturing. This sector is very important for India’s future growth as it has the potential to create more jobs (specifically labor-intensive sectors) and boost productivity levels in the economy.    

India has a long way to go to increase productive private corporate investment.

Increased investment by the private corporate sector is a must for higher growth and more jobs in the future. That requires policy certainty, economic openness, big-ticket reforms and improved growth outlook.

Policy uncertainty has increased over the last few years (Figure 2). During the golden years of investment, policy uncertainty was low and the share of private corporate investment in GDP increased from 6% in FY03 to 19% in FY08. The policy uncertainty index shot up during 2009-14 due to policy paralysis and rise of bad bank loans, which crushed private corporate investment activity in India. This situation was corrected somewhat between 2014 and 2019, when policy uncertainty declined significantly. But overall policy uncertainty remained higher compared to the 2003-07 period. Since 2020, policy uncertainty has further risen and the GDP share of private corporate investment has declined to 11% in FY23 (refer to footnote iii for details).

Figure 2: Policy uncertainty has increased and is higher than the golden period for private corporate investment during 2003-2007.
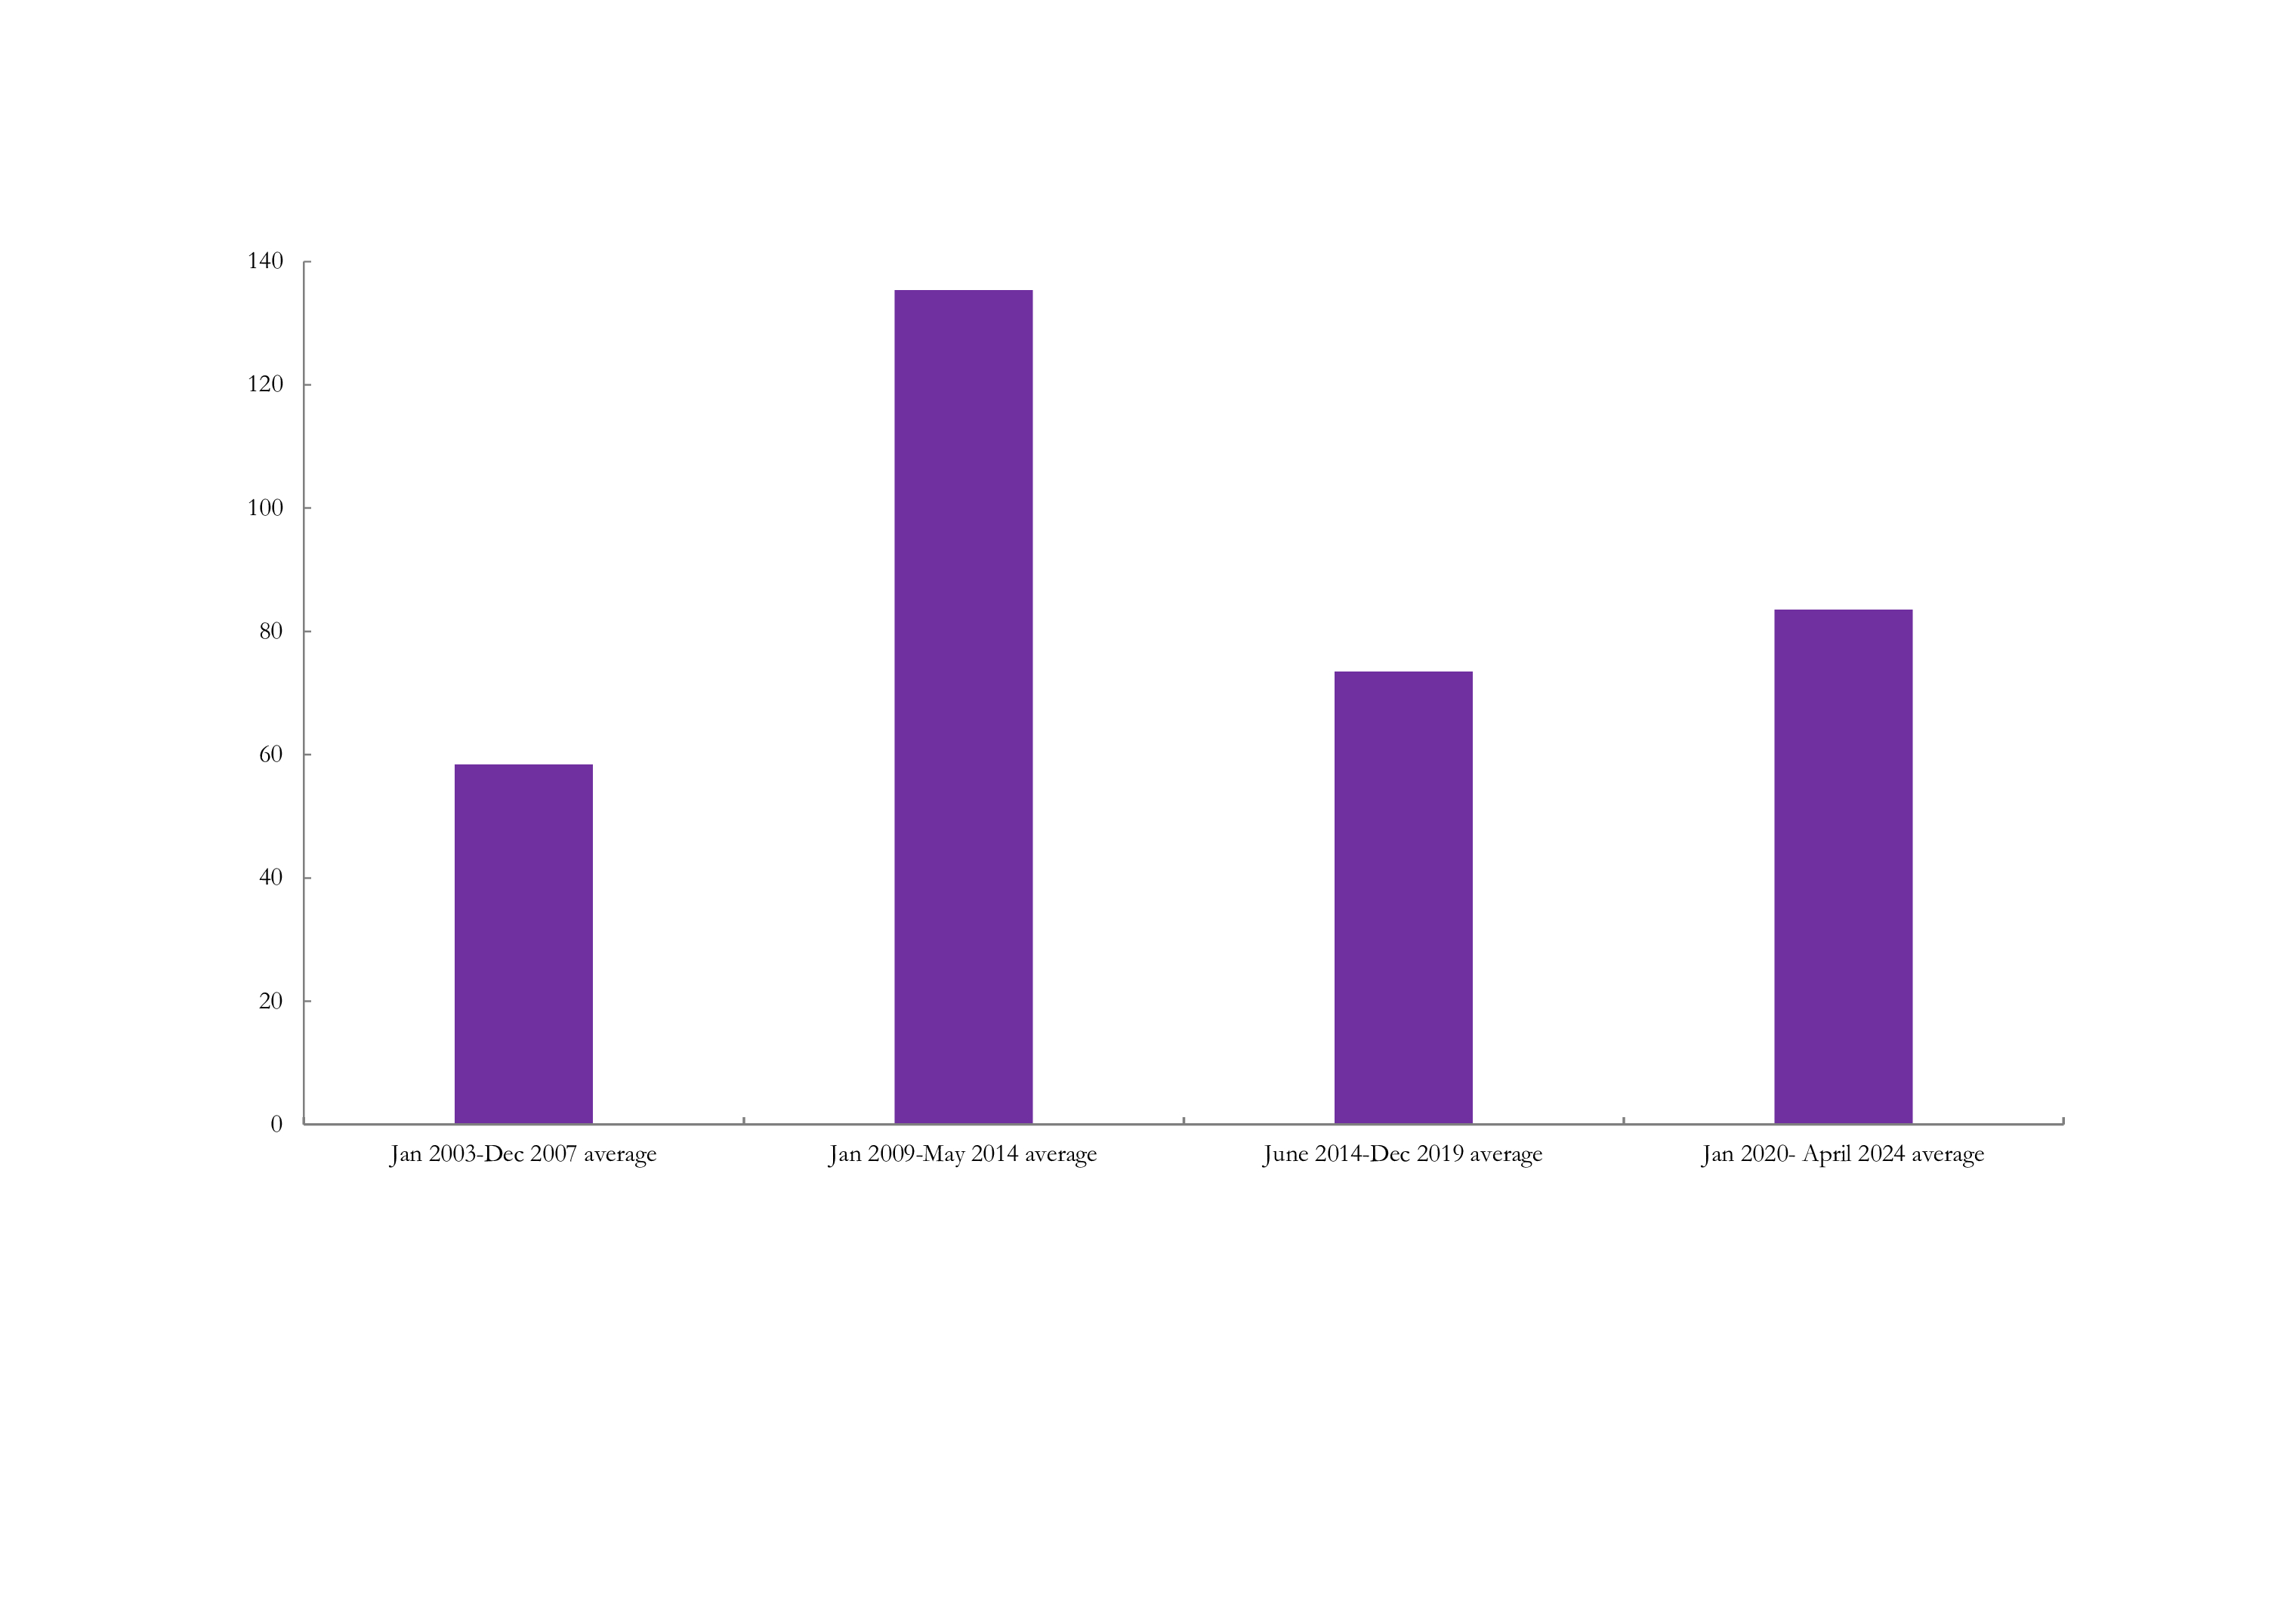
 

Source: https://www.policyuncertainty.com/india_monthly.html, authors’ calculations

India’s economy has become less open in a bid to build its manufacturing sector. Post-2014, tariff and non-tariff barriers have been raised to encourage domestic manufacturing, on the back of Atma Nirbhar Bharat and Make In India campaigns. Between 2014 and 2018, average tariff rate increased from 13% to 18%. This is higher than the rates in China (7.5%), Viet Nam (9.6%) and Bangladesh (14.1%). As this article highlights, various policy initiatives and campaigns to boost manufacturing in India have not been effective, with investment in the sector barely increasing from 4.6% of GDP in FY20 to 4.8% in FY23.

A few important reforms, that can boost growth and investment, have been ignored or shelved – significant barriers to foreign direct investment in the services sector need to be removed, labor market regulations should be simplified and eased, land administration and acquisition needs to streamlined and reformed, access to basic infrastructure like water and power supply needs to ensured.

Moreover, the recent remarkably high GDP growth rates, due to statistical and methodological peculiarities, mask a weak growth outlook and a slowdown in private consumption growth. This is evident in the tone of the private corporate earnings calls, during which the top executives raised concerns over GDP growth estimation, sector’s limited private investment plans and weak consumer demand in rural areas (https://indianexpress.com/article/business/economy/as-india-inc-commends-gdp-growth-some-concerns-private-capex-sluggish-rural-demand-9331772/#:~:text=As%20India%20Inc%20wraps%20up,in%20private%20capital%20expenditure%3B%20and). Weak growth outlook signifies lower returns on investment for the private corporate sector.

Economic analysis requires patience and attention to detail.

Off-hand commentary on shallow analysis of investment hurts the prospects of Indian economy. While economic commentators and market analysts might win brownie points with the government for their optimistic coverage of investment and growth in the country, their imaginative commentary cannot replace the reality on the ground.

If investment activity was genuinely strong then data would have shown more quality jobs and higher private consumption growth. Instead, since 2020, the numbers of self-employed workers (such as the tea sellers, vegetable vendors and rickshaw pullers) have increased, reflecting the sorry state of India’s job market. Incomes of people have stagnated and private consumption has grown at a slow pace.

To secure its economic future, India must commit to substantial structural reforms that will create an environment favorable for private corporate investment.

***

Footnotes

  • Investment can be broadly categorized as public and private. Public investment includes central and state governments as well as public sector units (PSUs). Private players include the corporate sector and, households and household enterprises.

While government investment involves building roads, ports, school infrastructure etc, private corporate investment and investment by PSUs comprise of factories, equipment or machinery, office buildings etc. This kind of investment is essential for India’s development and transition from a low-middle income country to a high-middle income country like Malaysia, China and Chile are.

Conversely, investment by households and household enterprises (HHs) include agriculture equipment like tractors and electric threshers, auto rickshaw and taxis, a make-shift tea shack and a mechanic shed by the side of the road, an apartment in a residential complex and tools for a pickle making enterprise operating out of a house.

  • One could also argue that this is just the direct contribution of public investment. The indirect contribution, which the economists like to call the ‘multiplier’ effects of public investment, is larger. For example, think of a highway constructed between two cities. It lowers the transportation costs and boosts trade and commerce between the cities. Businesses flourish as they expand and hire more workers. But this indirect effect in India is reduced by huge maintenance costs of infrastructure and other transaction costs like corruption and poor quality of new infrastructure.
  • For a more detailed analysis of how policy uncertainty has been increasing and how it severely impacts the returns on private investment, please read these excellent and detailed articles by Shruti Rajagopalan (https://srajagopalan.substack.com/p/an-economic-puzzle-of-the-modi-years?utm_campaign=post&utm_medium=web&triedRedirect=true) and by Arvind Subramanian and Josh Felman(https://www.foreignaffairs.com/articles/india/2021-12-14/indias-stalled-rise).
Add a comment

About Us

Our journey as a modern nation statestarted in 1947 with the historic speech byPandit Jawaharlal Nehru, with 95% illiteracy, barely any industry and transport system, armed forces that were divided due to partition lacking equipment was largely in disarray, if there were guns- then the dial sights were taken away by Pakistanis, making the guns ineffective, if there were files- maps were taken way by Pakistanis, if there were battalions, half the men had gone away to Pakistan and so on.


Archived Articles

Find us at

Address : Indore, (M.P)

Mobile : +91-9981120072

Email : bharatamrising@gmail.com

Send us a message

Links

Bharatam Civilization

Politics

Geo-Politics and Security

Society

Science and Technology

  • Achievements
  • Latest

Economy

  • Achievements & Challenges
  • Latest

Art and Culture

  • Unique Features & Achievements
  • Latest

Citizens Corner